 Chartly
Manual backtesting with candle replay
Use saved market data to test a strategy as you would trade it. Step through candles, make decisions with the data visible at the time, and record the result in a separate paper account.
This guide describes the self-hosted app. The public preview lets you try sample paper replay in your browser.
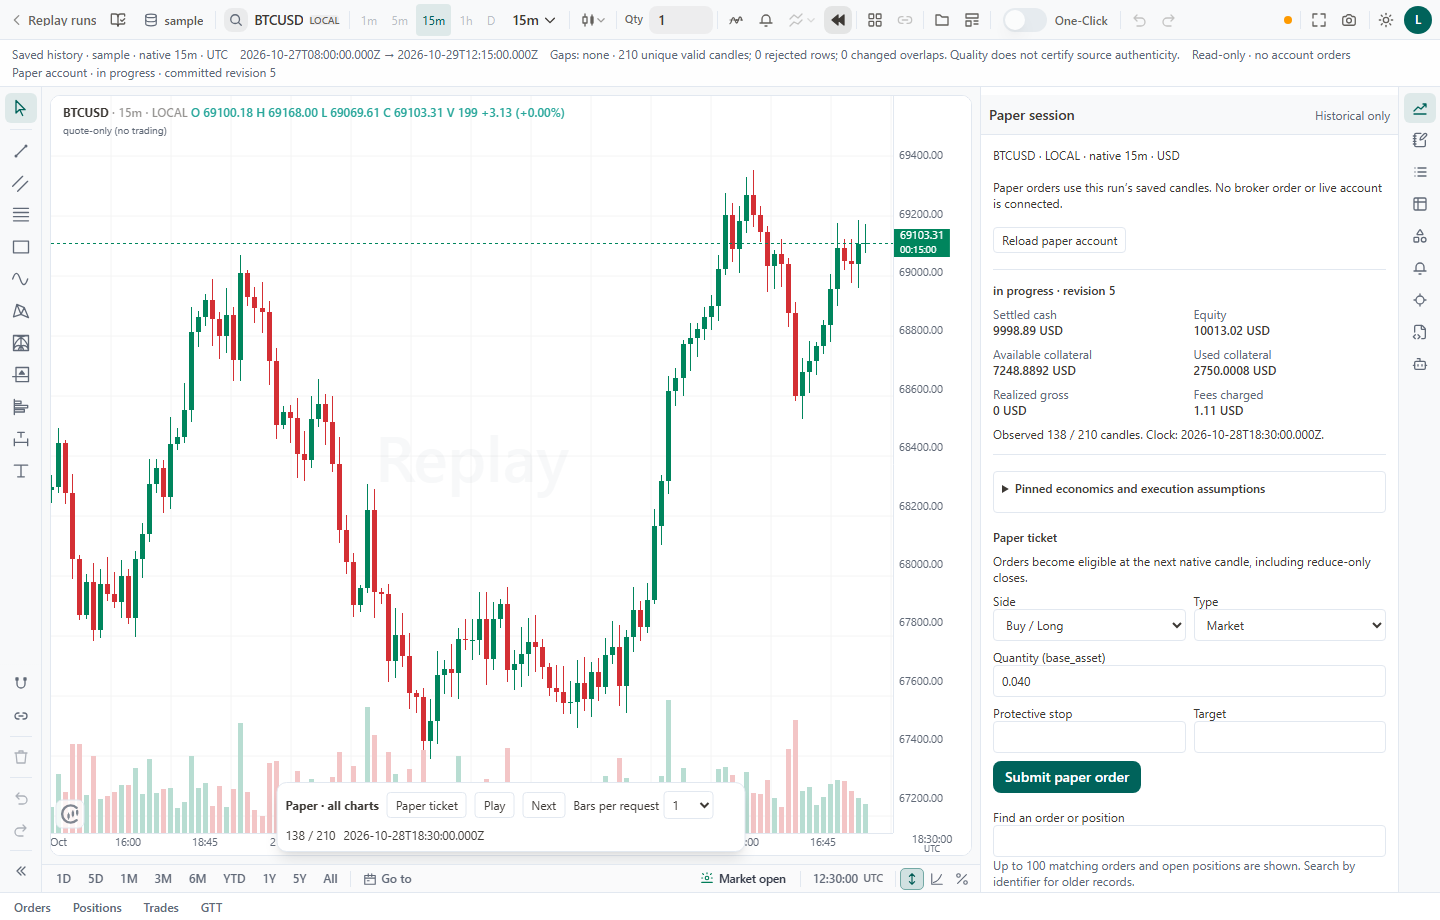
Prepare a replay project
You need historical candles for the symbol and timeframe you want to test. Chartly’s Data Library can import candle CSVs. Use a dataset that covers the session you want to review.
- Import your candle history and check the symbol and interval.
- Open Workspace, create a replay project, and select the saved history.
- Start a paper run with the balance, currency, spread, slippage, and fees you want to model.
Apply your trading rules in replay
Write down the conditions for an entry, the exit rule, and your position sizing before stepping forward. Use the chart’s drawings and indicators to mark the setup. Advance one candle at a time when you need to see how a signal develops.
Review simulated fills and P&L
Use the run report to inspect entries, exits, fills, costs, and P&L. Start a separate run to compare a different rule or a different period. The replay workflow records decisions you make on the chart and results from the paper execution model.