 Chartly
Trading chart indicators and drawings
Overlay indicators on price, add studies in a separate pane, and annotate the levels you want to revisit in your trading journal.
This guide describes the self-hosted app. The public preview lets you try sample paper replay in your browser.
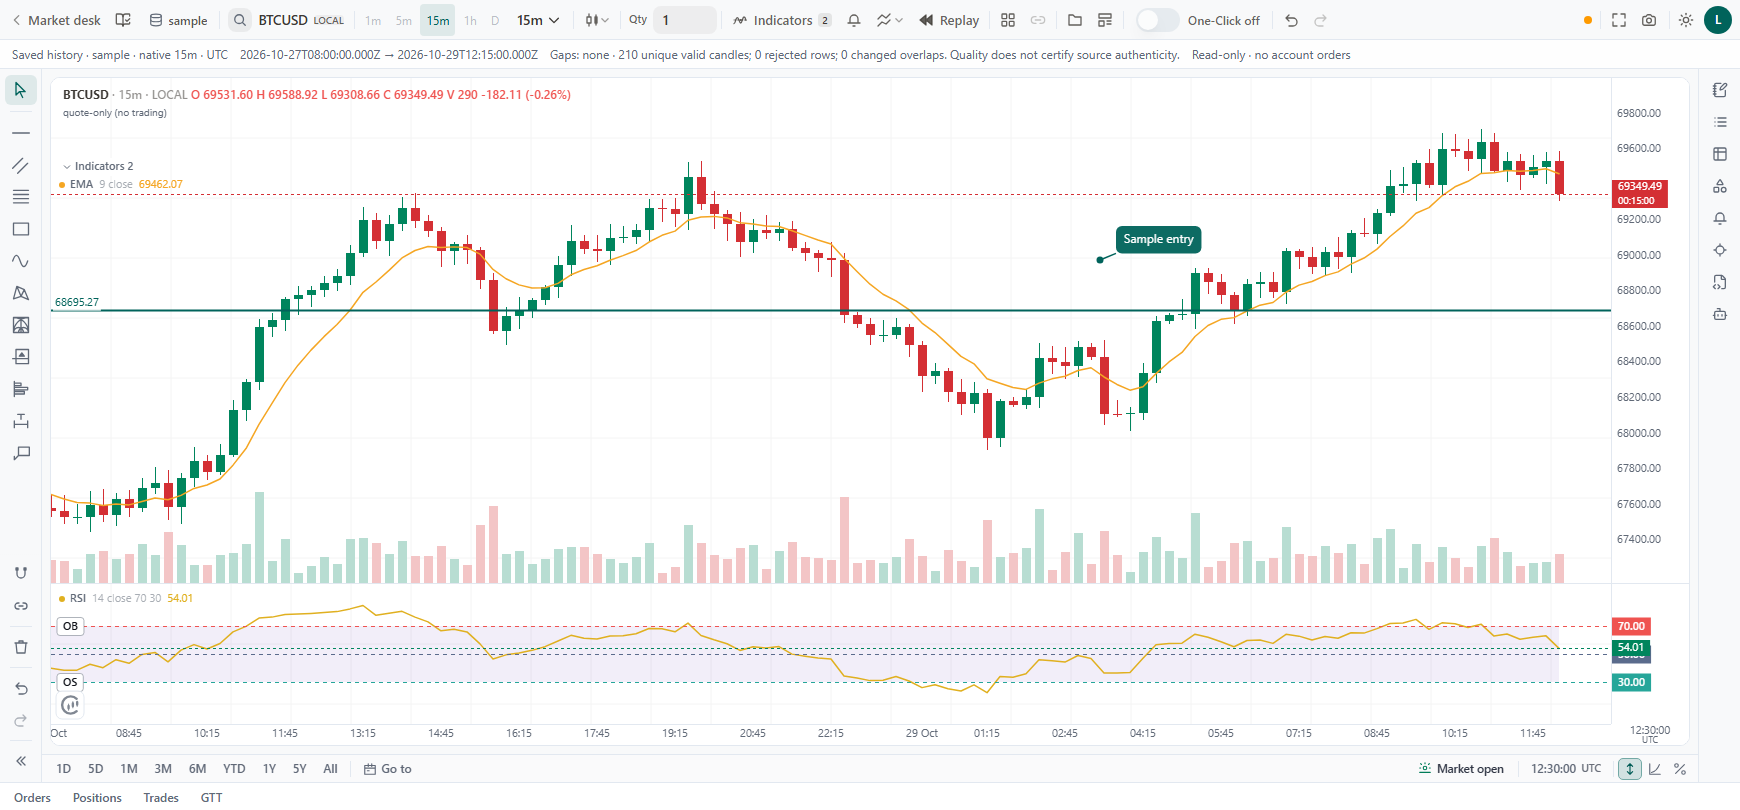
Combine an overlay and a separate study
An exponential moving average (EMA) can sit on the candlestick chart while the relative strength index (RSI) occupies its own pane. This keeps price and the indicator’s scale readable.
- Open a chart with saved candles or a supported live feed.
- Use Indicators to search for EMA and add it to the price pane.
- Add RSI, then use the drawing toolbar to mark a price level or label a setup.
Compare context across chart panes
Use a multi-pane layout to compare instruments or timeframes. Choose the symbol and data source for the chart you are working on.
Use the chart in replay and trade review
Mark up a setup while you step through saved candles in paper replay. From the journal, open a trade on its chart to review the market context and return to the same book.