 Chartly
Self-hosted trading workspace
Chart the market. Practise before you trade.
Follow a live account or practise with saved market data. Use the same chart tools and keep every trade in the right journal book.
This public preview includes sample paper replay. Live accounts, trade journals, and automation run in the open-source Chartly app.
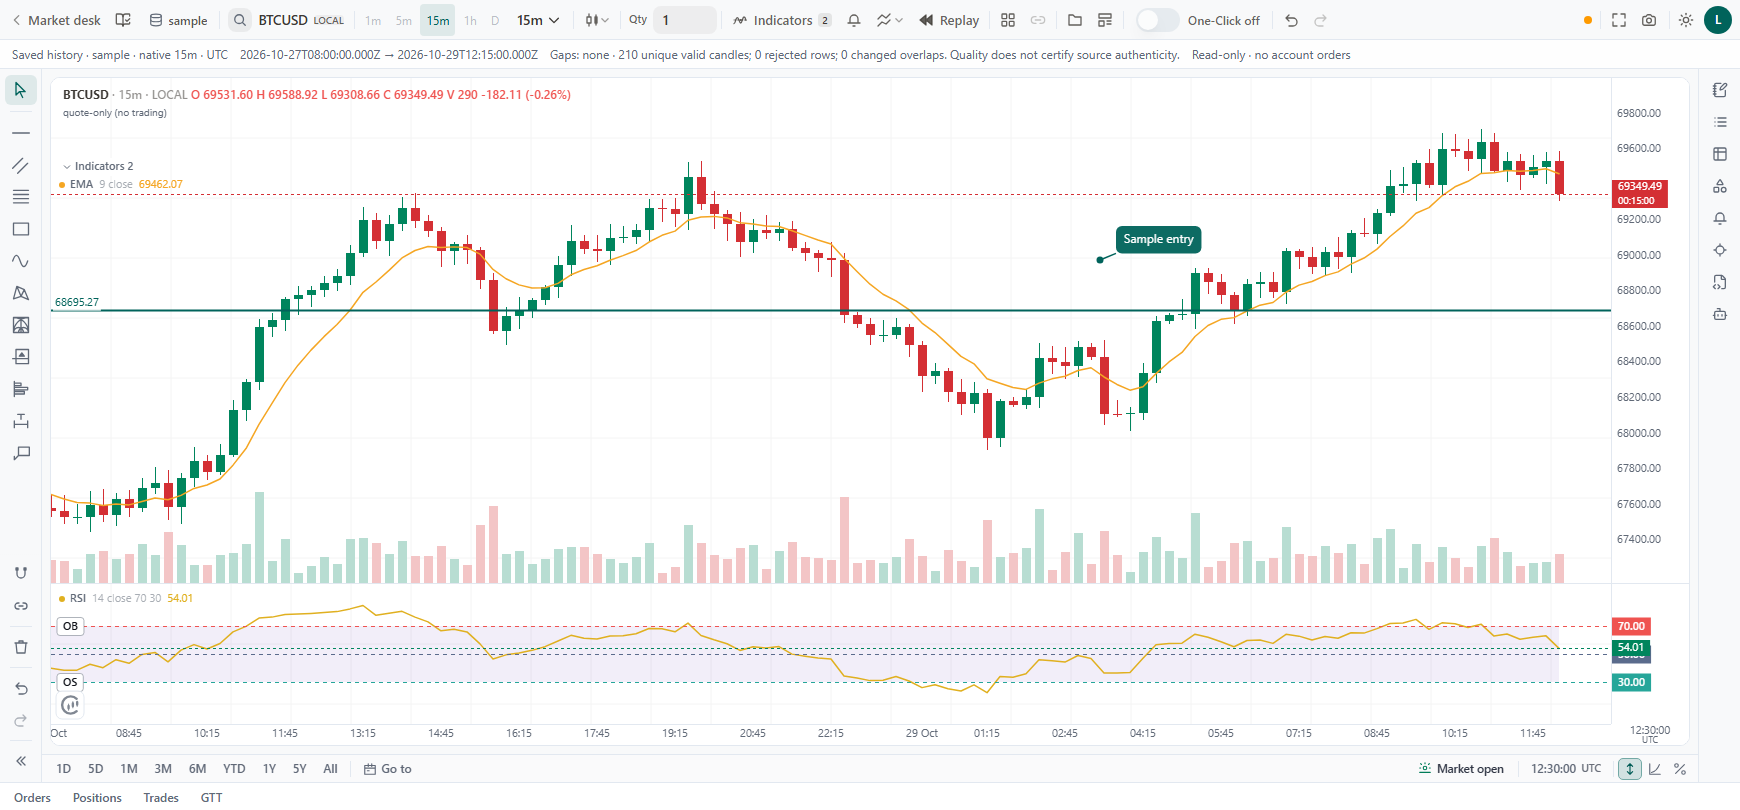
Indicators you can combine
Overlay an EMA on price and place an RSI below the chart. Add more studies or compare timeframes as you work.
Mark your setup
Draw support and resistance, label a planned entry, and attach chart evidence to your trade review.
Work across layouts
Use multiple chart panes and switch symbols, intervals, or data sources from the chart controls.
Paper trading & replay
Backtest a setup candle by candle.
Return to a market session and practise with a paper account. Replay lets you test your entry and exit rules as the next candle arrives.
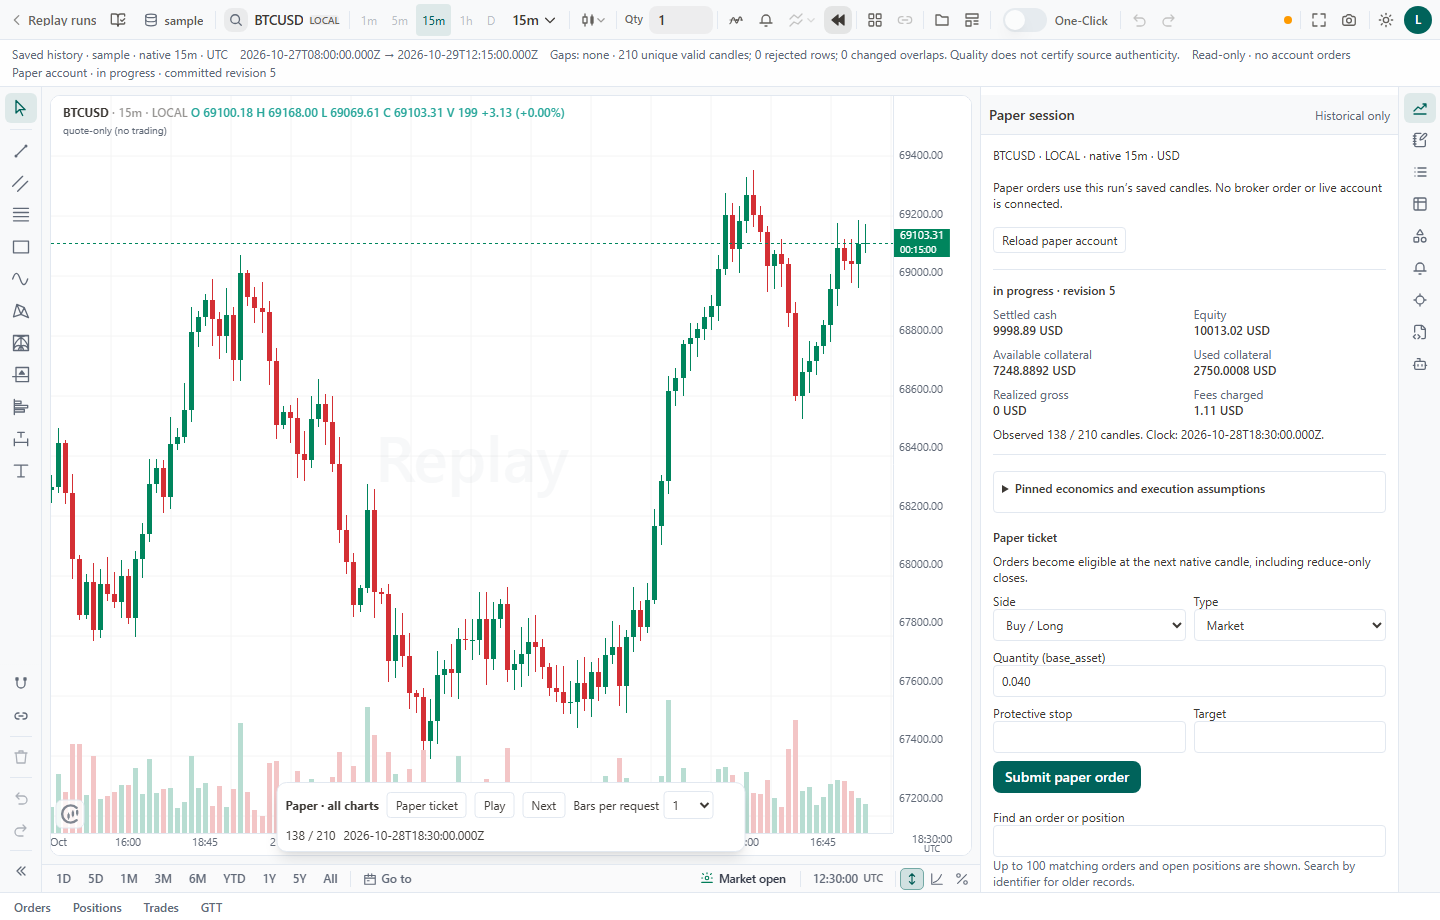
Choose your history
Import candles, select the symbol and period, and create a replay project.
Run the setup
Step one candle at a time or play forward. Place simulated orders with your own starting balance and cost settings.
Review the result
Compare entries, exits, fills, and P&L in a run report. Keep each run separate so you can repeat the same setup.
Live trading
Chart with your account in view.
Connect a supported account to a live profile. With MetaTrader 5 on Windows, link an already signed-in terminal and pull its symbols and account data into Chartly.
- Search the terminal’s broker-specific symbols.
- View balances, open positions, and working orders.
- Keep each verified account in its own live profile.
This MT5 preview shows read-only account data. Order entry depends on the connector and account permissions.
Set up MT5 charts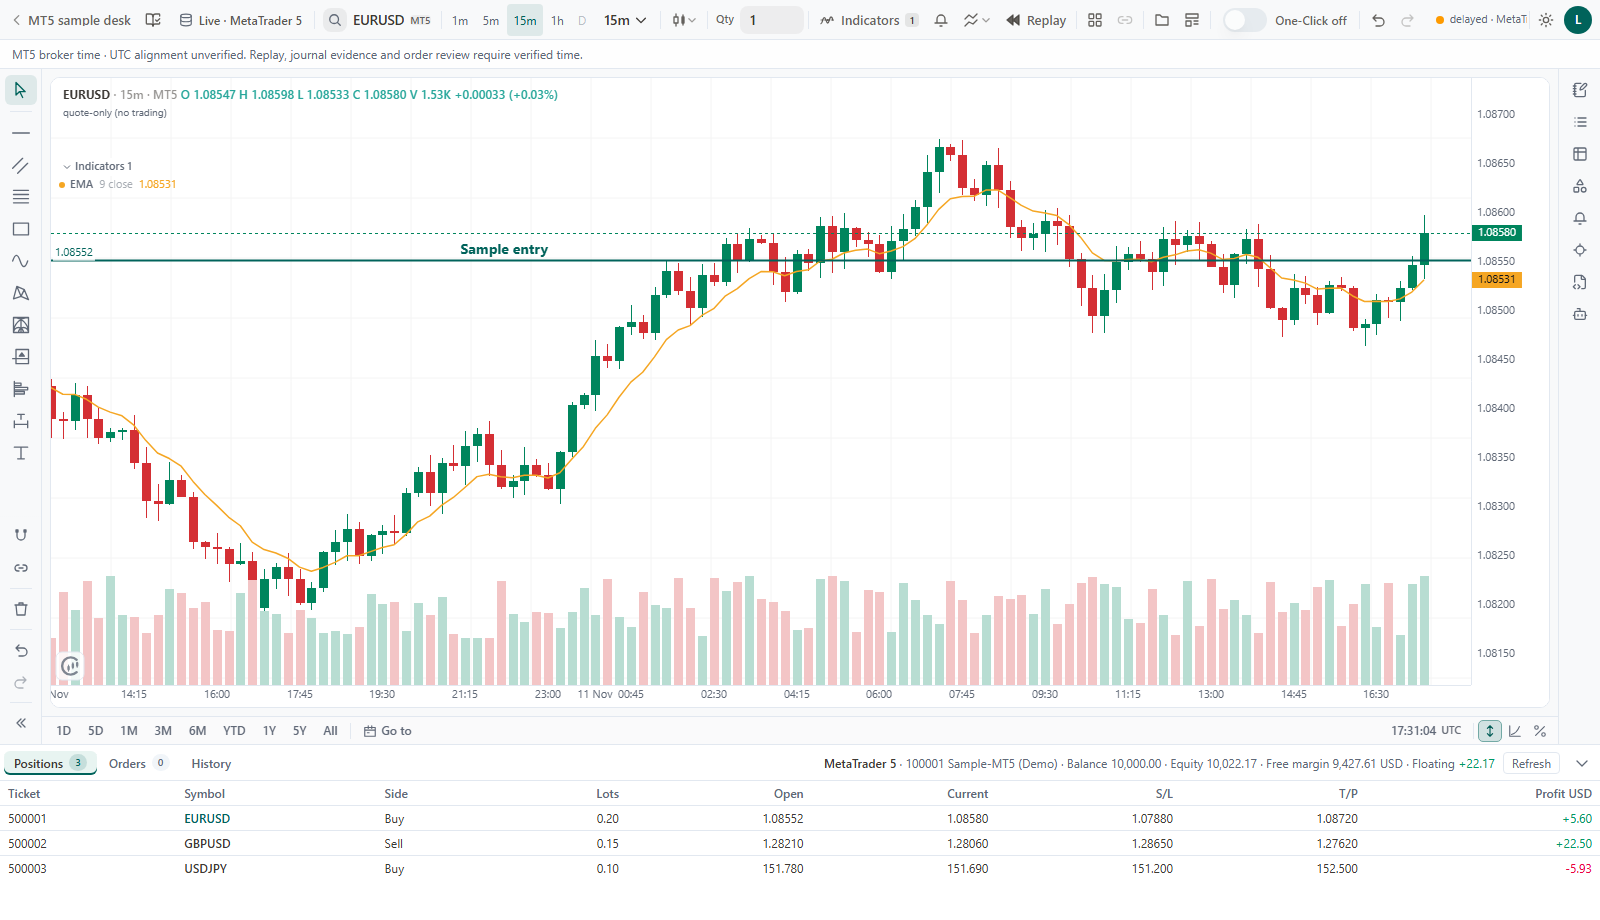
Trade journal
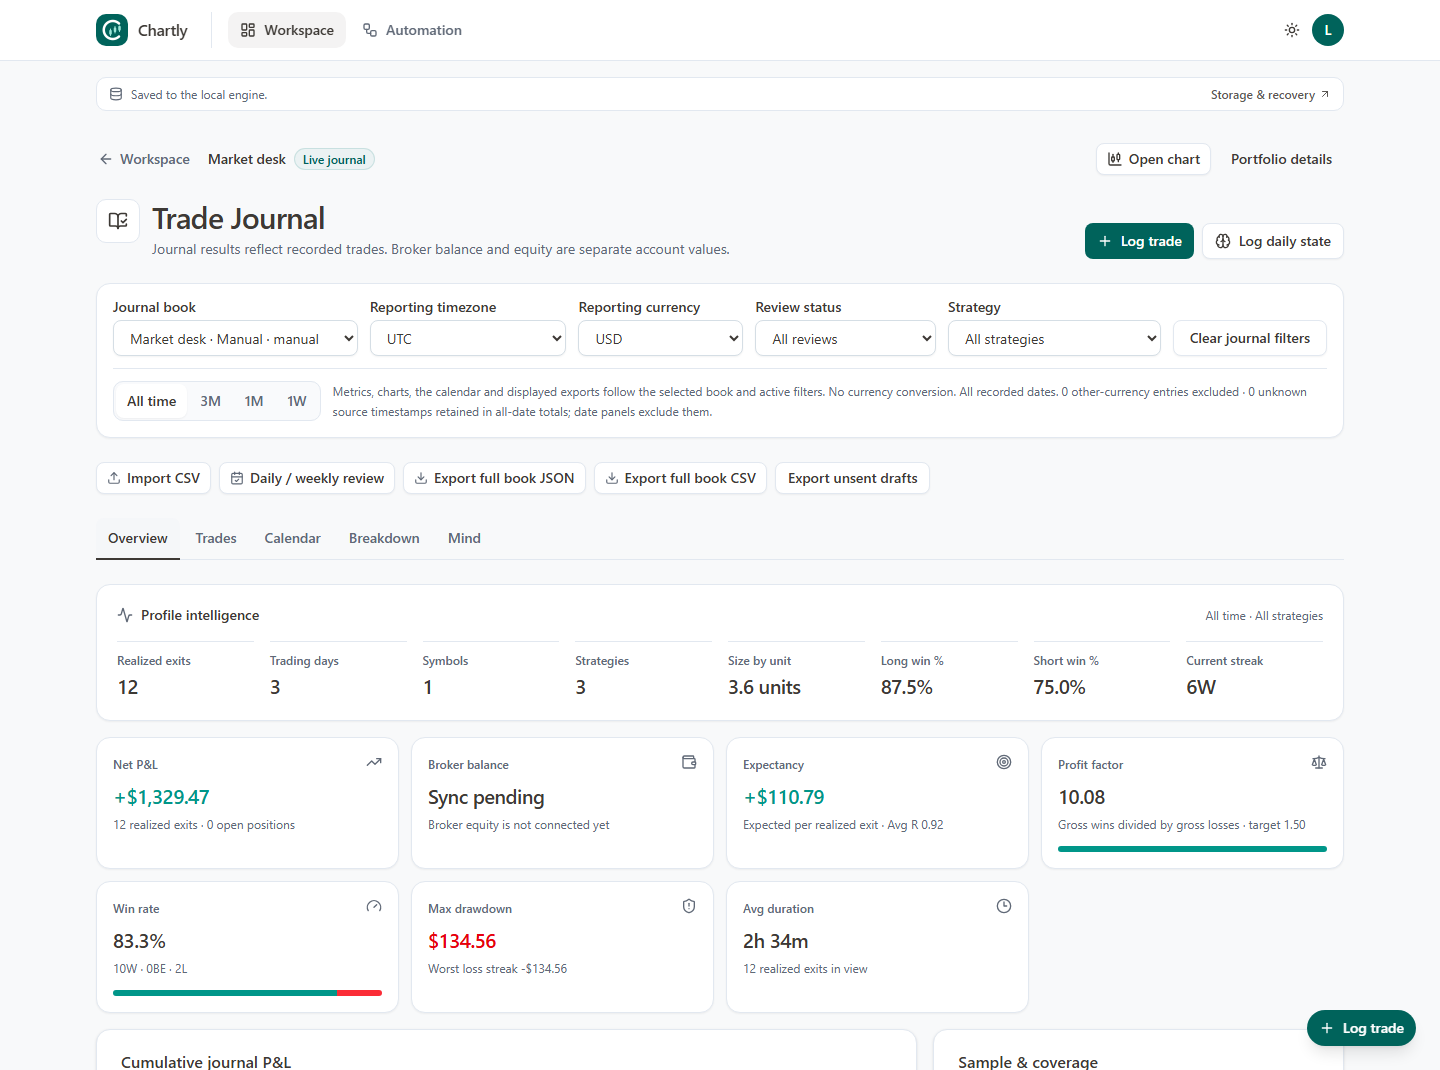
Every account gets its own book.
Log trades manually, import a statement, or sync where supported. Open a trade from its book to inspect the chart, then return to the same book and filters.
Review at the right level
Filter a book by strategy or time period, or choose which portfolios to compare in Combined Analysis.
Connections & data
Start with the data you have.
Choose the source that fits the job. Chart history and account activity can come from different places.
Read the MT5 setup guideSaved market history
Import candle CSVs into the Data Library. Reuse a dataset for charting or choose it as the source for a paper run.
MetaTrader 5 on Windows
Use a running, signed-in terminal. If you use separate MT5 installations, verify and link each account to its own live profile.
Statements and other providers
Import trade statements into a journal or connect a supported feed. Check what a provider offers for prices, history, or account access.
Workflows
Automate the steps you repeat.
Build a workflow around an alert, schedule, or webhook. Review approvals and see what ran from Automation.
- Trigger Alert, schedule, or webhook
- Conditions Decide when to continue
- Review Approvals and execution history
Getting started
Before you open a workspace.
Can I start without a broker account?
Yes. Create a manual journal book to log or import trades. For replay, import saved candle history first. A trade statement alone cannot reconstruct a market session.
Can I backtest a strategy in Chartly?
Paper replay supports manual backtesting. Move through recorded candles, apply your entry and exit rules, and review simulated results with your chosen costs. The replay workflow does not automatically optimise a strategy.
How does the MetaTrader 5 connection work?
Chartly uses an already signed-in MT5 terminal on the same Windows machine. Verify the account and link it to a live profile. Charts and account views depend on the connected terminal and its permissions.
Does Chartly include a market data subscription?
Chartly is self-hosted. You can bring your own history or connect a supported provider. Coverage, access, and any market data costs depend on that provider.
Start with a chart.
Choose a live profile, a replay project, or a standalone journal.